
Reading Stock Charts: The Basics was originally published on Forage.

Stock charts are graphs that show how a company’s publicly traded shares are performing. These charts can show a company’s stock performance over time periods ranging from several years to a few days. You can also even watch a company’s stock change throughout the day while the market is open.
Reading a stock chart can be confusing since they show so much data in such a small space, but in this guide, we’ll cover:
- What Are Stock Charts Used For?
- How To Read Stock Charts
- How To Show You Understand Stock Charts on Your Resume
- Related Investing Skills
What Are Stock Charts Used For?
In the most basic sense, when reading a stock chart, a green line going upwards is good, and a red line trending down is bad. However, stock charts provide a lot of information beyond that. Stock charts can indicate a company’s performance over a number of years, tell you how much the stock is trading at and recent changes in the price, and give details about the overall company’s value.
Stock charts are often used by investing professionals, like investment bankers and stockbrokers, to help inform investment decisions and track company performance. But stock charts are also used by average people outside of careers in finance. Some people read stock charts because they have investments in the stock market or just because the performance of the stock market has a serious impact on the overall economy.
Stocks are traded on specific markets. For publicly traded companies in the United States, shares are typically bought and sold on either the National Association of Securities Dealers Automated Quotations Stock Market (NASDAQ) or the New York Stock Exchange (NYSE).
Find your career fit
Discover if this is the right career path for you with a free virtual work experience.
How To Read Stock Charts
Stock charts can be overwhelming at first glance, but once you understand the basic components, they are fairly simple to understand. We’ll take a look at an example of a stock chart and go through all the components.
What Do Stock Charts Look Like
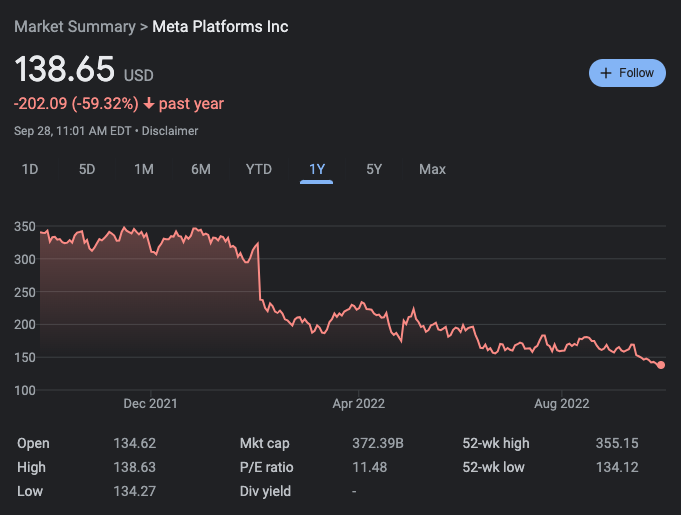
The chart below is Meta’s stock over the past year, courtesy of Google Finance, a website hosted by Google that provides real-time financial data.
Company stocks are traded under a stock symbol or ticker — a short-hand representation of the company, typically five letters long or less. For example, stock symbols for some of the biggest companies include:
- Google: GOOGL
- Amazon: AMZN
- Facebook: META
- Apple: AAPL
- Microsoft: MSFT
>>MORE: Check out the top tech companies.
Components of Stock Charts
Below the chart, you can see a lot of information about the stock itself, including:
- Open: What price the stock was at when the market first opened for the day
- High: The highest price the stock has been at, for that day
- Low: The lowest price the stock has been at, for that day
- Mkt cap (market capitalization): The total value of all the company’s stocks owned by shareholders
- P/E ratio (price/earnings ratio): A ratio of the company’s share price to the company’s earnings per share
- 52-week high: The highest price the stock has traded at in the previous 52 weeks
- 52-week low: The lowest price the stock has traded at in the previous 52 weeks
- Div yield (dividend yield): A percentage showing how much of the company’s share price it pays out each year in dividends to shareholders (Not every company will have a dividend yield.)
Using these components, you can begin to understand how the company has performed in the past. This information is pivotal to make predictions about how a company will perform in the future. Companies with steady, gradual growth are likely to continue that growth, barring any big economic changes (like a recession).
Stock charts primarily give you an idea of if the company is worth investing in. For example, a momentary slump in stock prices after a long trend of growth may be a good opportunity to get in when the share price is low. Or, a relatively new company that is performing well but has cheap share prices can be a good chance to get in early before the company really takes off. (Note: This example is for educational purposes; consult a financial adviser for specific stock-picking advice.)
Expand your financial knowledge with Forage’s finance virtual experience programs.
How To Show You Understand Stock Charts on Your Resume
Ultimately, if you have experience or skills related to investing or investment management, it will be understood that you can read stock charts. Reading stock charts is a common aspect of specific skills like “company valuation” or “portfolio analysis and management.”
If you don’t have investing experience as part of a previous job or internship, you can include any personal trading experience you have in a cover letter. For example, you could talk about how you closely followed the GameStop short squeeze in 2021 and managed your own investment portfolio as part of it.
Find out more ways to show off your hard skills.
Related Investing Skills
Reading stock charts is pivotal to many careers in finance and investing. Some other skills that investing professionals need to know include:
- How to complete a discounted cash flow (DCF) valuation
- What a special purpose acquisition company (SPAC) is and why they matter
- How to do a comparable company analysis
- How to calculate a company’s compound annual growth rate (CAGR)
Think investing may be the right career for you? Learn the skills you need to succeed with Forage’s Investment Banking Skills Passport.
Image credit: myronstandret / Depositphotos.com
The post Reading Stock Charts: The Basics appeared first on Forage.